This post is part of an eight-part series on graphic design for eLearning. You can look for this series every other Thursday here on our blog (and sharpen your skills with each and every post.)
We’ve talked before about graphic design as a whole for eLearning development, but today, we’re going to focus in on one specific topic: Using well designed infographics to enhance your course.
First of all, let’s make sure we’re all on the same page about infographics. Infographics are graphic visual representations of information, data or knowledge intended to present information quickly and clearly.
Here’s an example of what an infographic looks like:
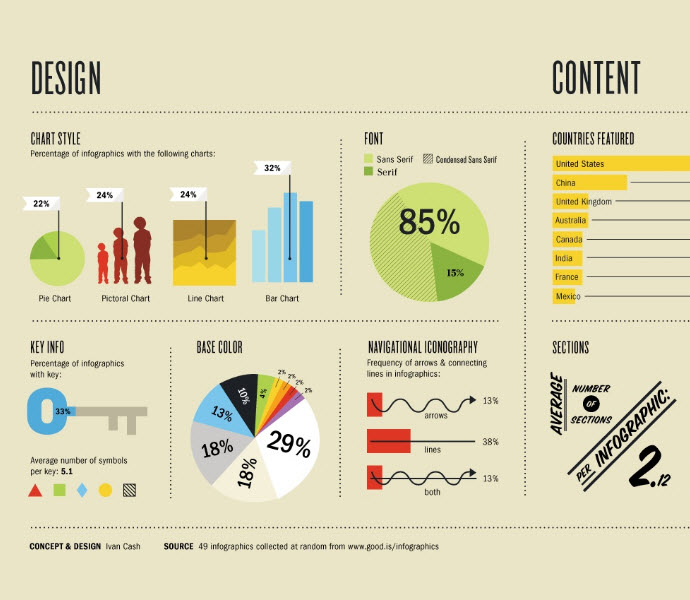
In this post, we’ll look at the science behind infographics and talk about how you can use smart graphic design to create your own infographics that greatly enhance your eLearning courses.
The Science Behind Infographics
Designing an infographic for your eLearning course helps learners digest small pieces of data more easily because they are presented in a visual format that aids learners in chunking the information. Chunking is used to help manage and compact the information being presented to the limited capacity of one’s working memory. Especially in this format where there’s no in-person trainer, chunking helps present content in a way that’s simple, logical, and meaningful.
Why is this important?
Because 90% of the information transmitted to the brain is visual—and visual data is processed 60,000 times faster in the brain than text. Some research even shows that as much as 40% of people will respond better to visual information than text.
Here’s an example that demonstrates this fact: Look at the words and the image below.

While you can instantly understand the image (that communicates anger), it takes a little longer to read the words that communicate the same message.
The reason our brains work this way is because many of the interactions between humans come from nonverbal cues. We read peoples’ body language and expressions to make sense of the people we interact with and respond accordingly.
Now look at these numbers: 80% of people remember what they see and do, while only 20% remember what they read, and even less (10%) remember what they hear.
Including an infographic alongside your other graphic design elements in your eLearning course means it’s much more likely that the information will stick.
How to Make Great Infographics for eLearning
Infographics can be a powerful addition to your course—when done the right way. A few things to remember:
Give facts room to breathe. Don’t try to crowd too much information into your infographic, but instead use negative space to let each nugget of information stand out.
Tie in other elements of graphic design from the course. Your infographic should be a seamless addition to the course—not an oddball that sticks out from everything else.
Pick a relevant color palette. Sticking to a few coordinating colors that go with your course keeps the visuals cohesive.
Make it readable. You’ll be tying in graphics and a little bit of text here…so make sure it’s not so small that it gets tough to read.
Make it interactive. Depending on the course requirements and budget, adding interactive features to your infographic can make it even more engaging for the user.
Use Infographics to Improve Your eLearning Course
Even if you don’t have a graphic designer on staff, you can put together a great looking infographic that can be tied in seamlessly with your course.
DIY approach: Canva has many free and low-cost graphics to help you build and customize an infographic from scratch.
Low-cost option: Sites like Fiverr can connect you with freelance designers who complete small, one-off assignments for as low as $5.
The Bottom Line
A well-designed infographic can be a great way to package information in a way that makes it easy for learners to understand. Just remember: Keep it cohesive with the course, and consider Cognitive Load Theory. Try to find a balance between aesthetics and learning.